
NIMBUS SUITE · SENTRY
Be the first to know when something goes down
Nimbus Sentry watches everything that matters: websites, servers, network, certificates, DNS, mail flow and even hardware. With checks every minute, instant alerts over WhatsApp or email, a public status page and provable availability per customer. Multi-tenant, so ideal for administrators of multiple environments.
From "a customer called to say the site was down" to being ahead of it
Downtime costs revenue and trust, and you usually hear about it too late. Sentry watches your environment continuously from multiple locations and warns you within seconds, with enough context to act right away.
This is what Nimbus Sentry looks like
Real screens from our own production environment, where we monitor the complete Nimbus Suite.
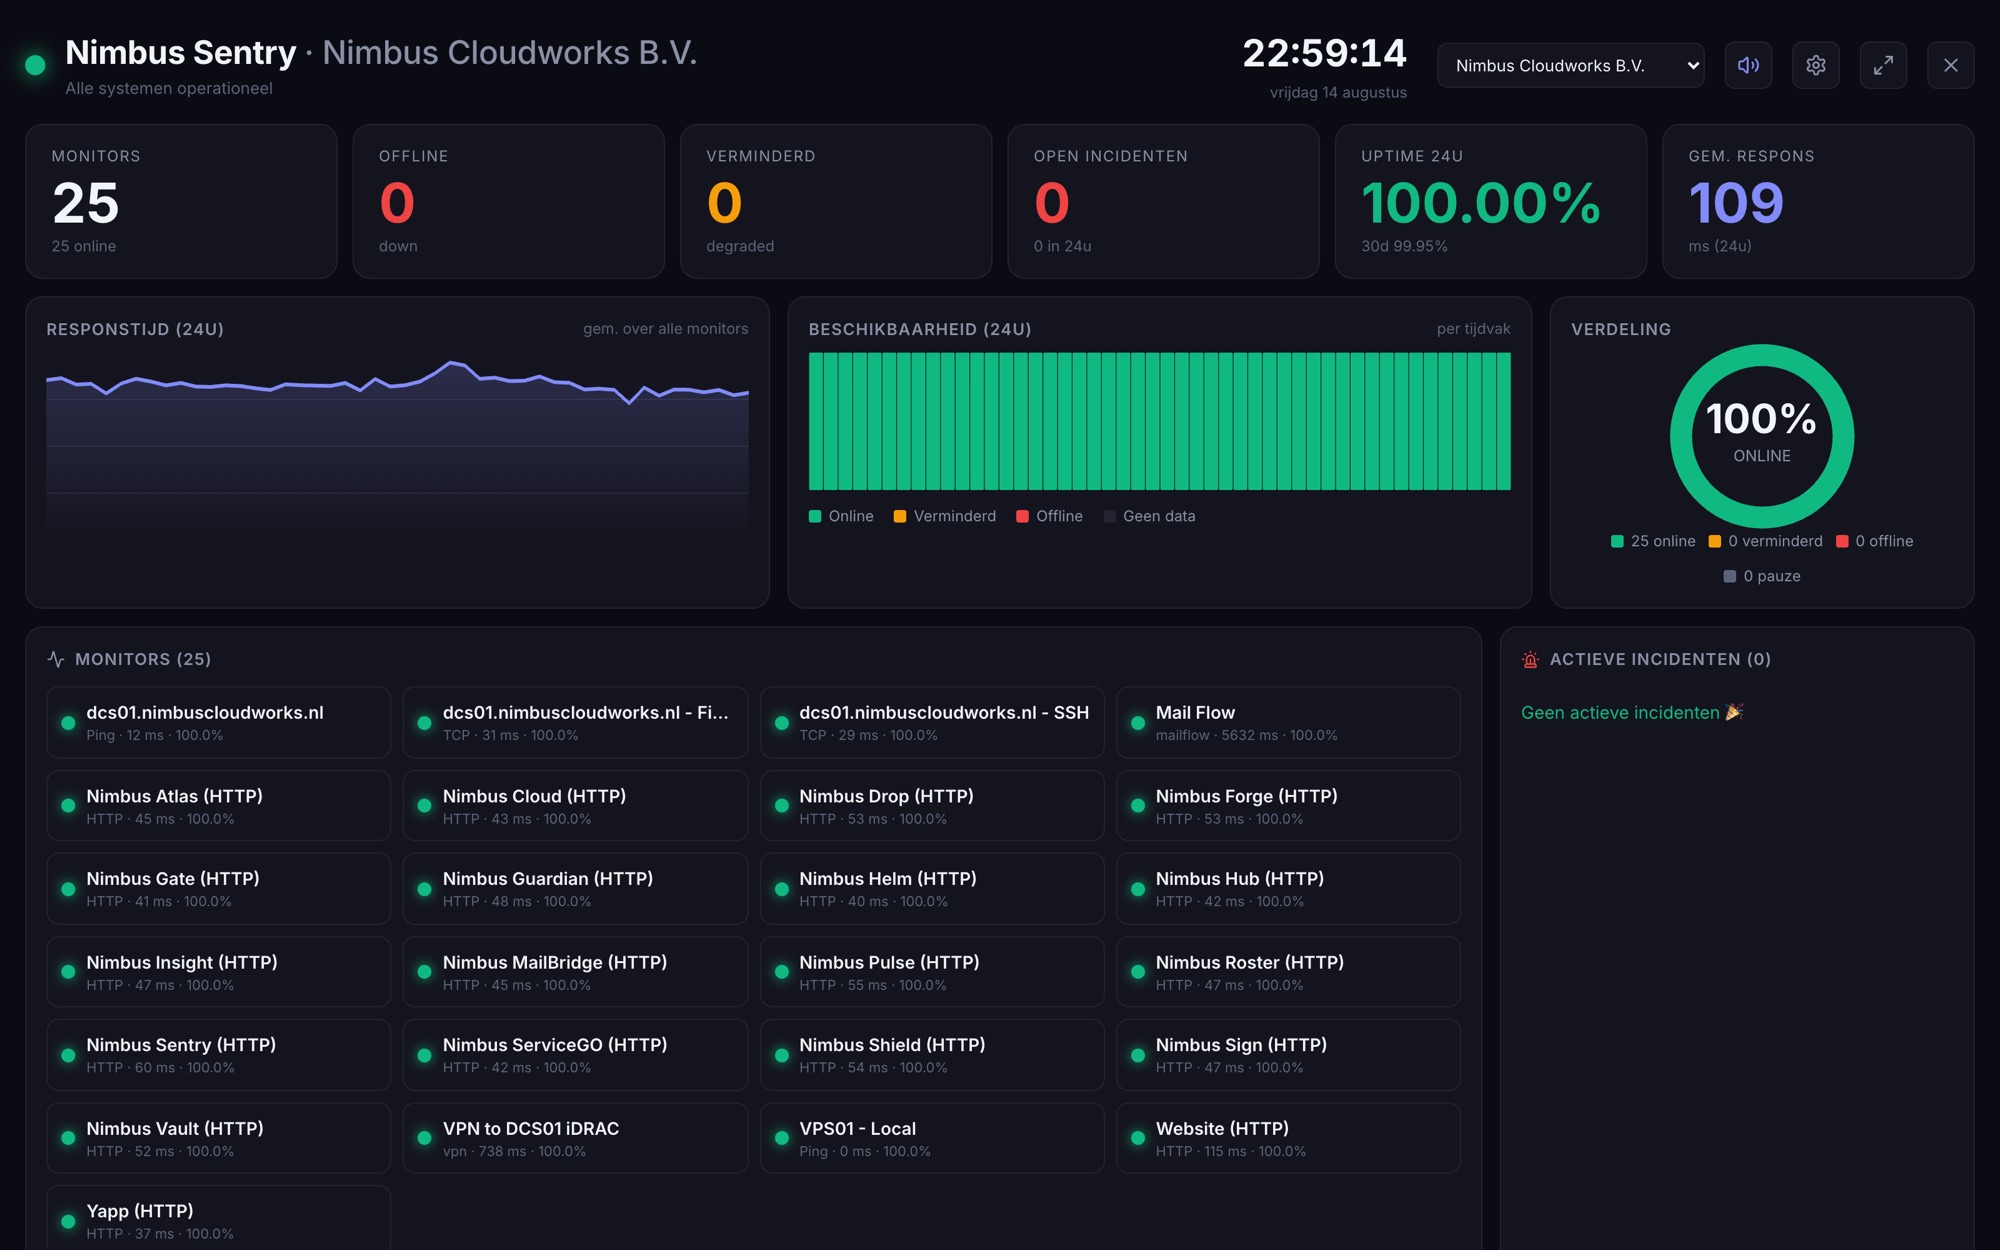
One screen the whole service desk keeps an eye on
Put Sentry on a large screen in the support room. Status cards, response times, availability per time window and active incidents, all refreshing themselves. Green means calm, red you spot from the other side of the room, with sound the moment something falls over.
- Uptime over 24 hours and average response at a glance
- Monitor wall with status and response time per service
- Active incidents right next to it
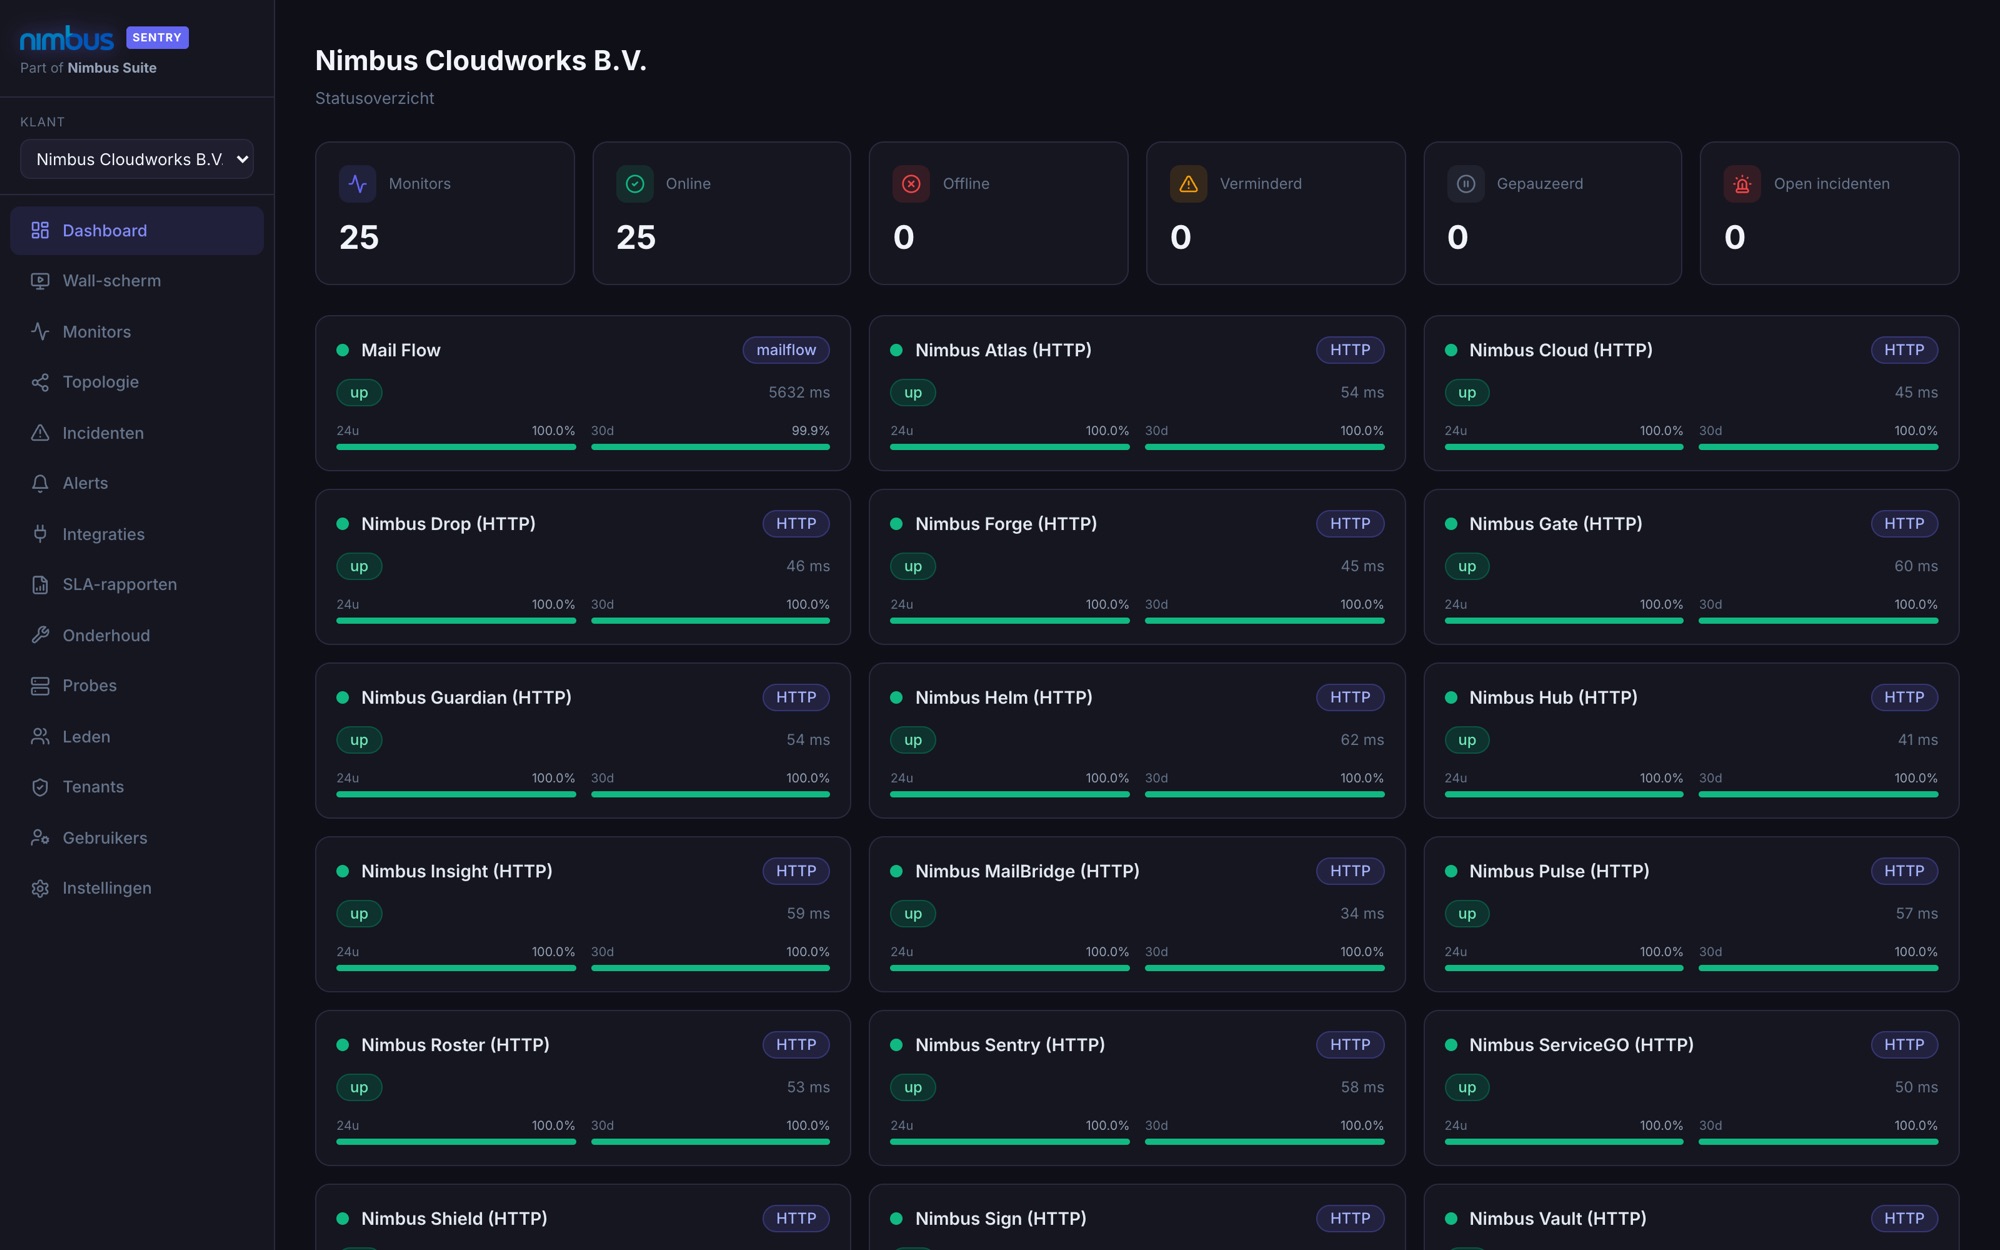
A clear status overview per customer
Switch customer at the top and see straight away how many monitors are online, offline or degraded. Each card shows the latest response time plus availability over 24 hours and 30 days, so a creeping problem stands out before it becomes an outage.
- Counters for online, offline, degraded and open incidents
- Availability over 24 hours and 30 days per monitor
- Strictly separated per customer, with roles and SSO
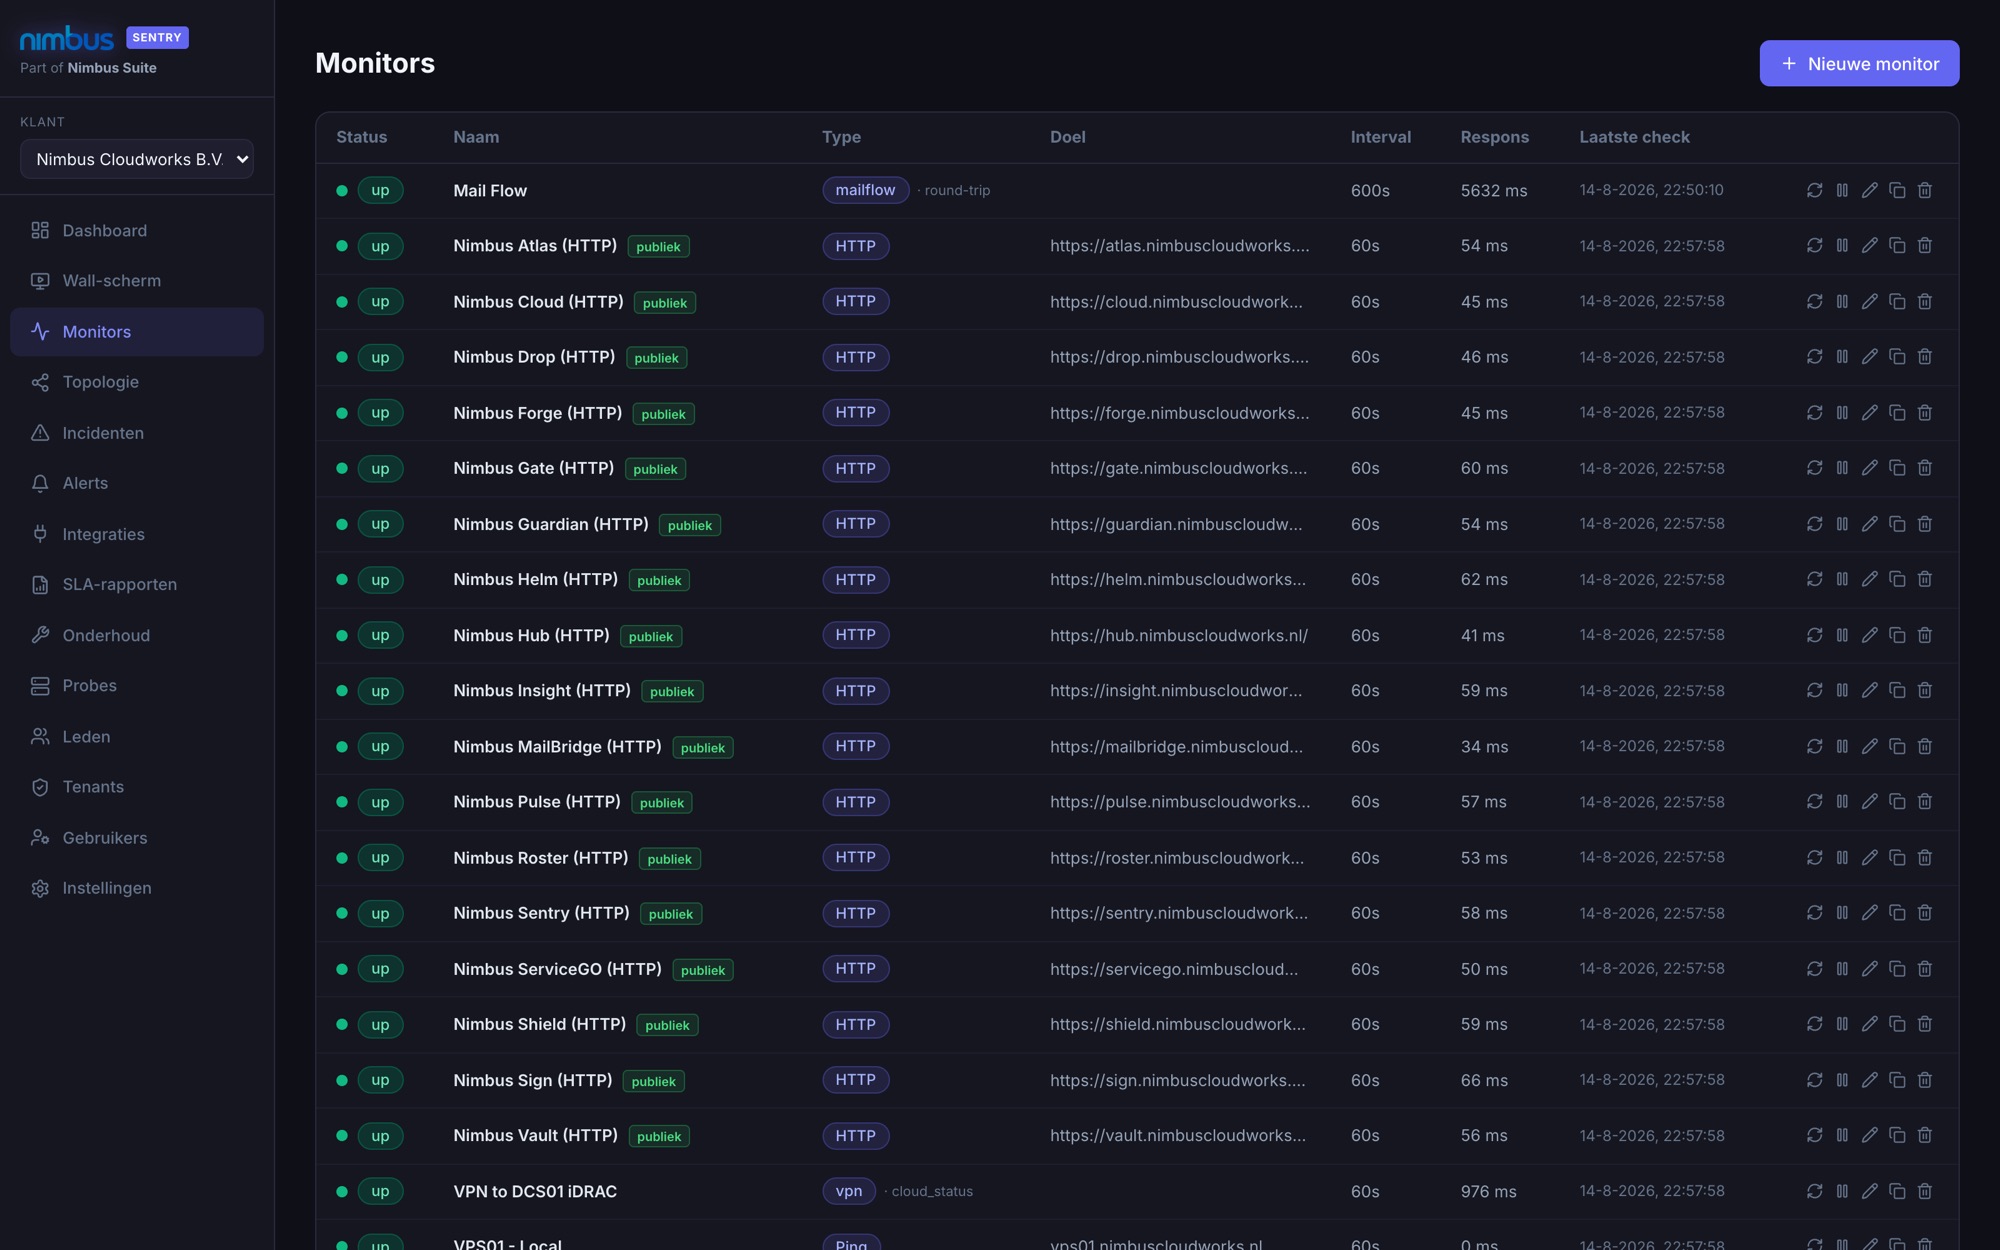
Everything you want to monitor, in one list
Websites and APIs (HTTP), ports (TCP), reachability (ping), DNS, certificates, cron jobs (heartbeat), VPN tunnels, hardware via iDRAC and even a real mail flow test that sends a message and measures the delivery time.
- Interval, thresholds and publication per monitor
- Pause, duplicate or re-check straight away
- Public monitors are published on the status page
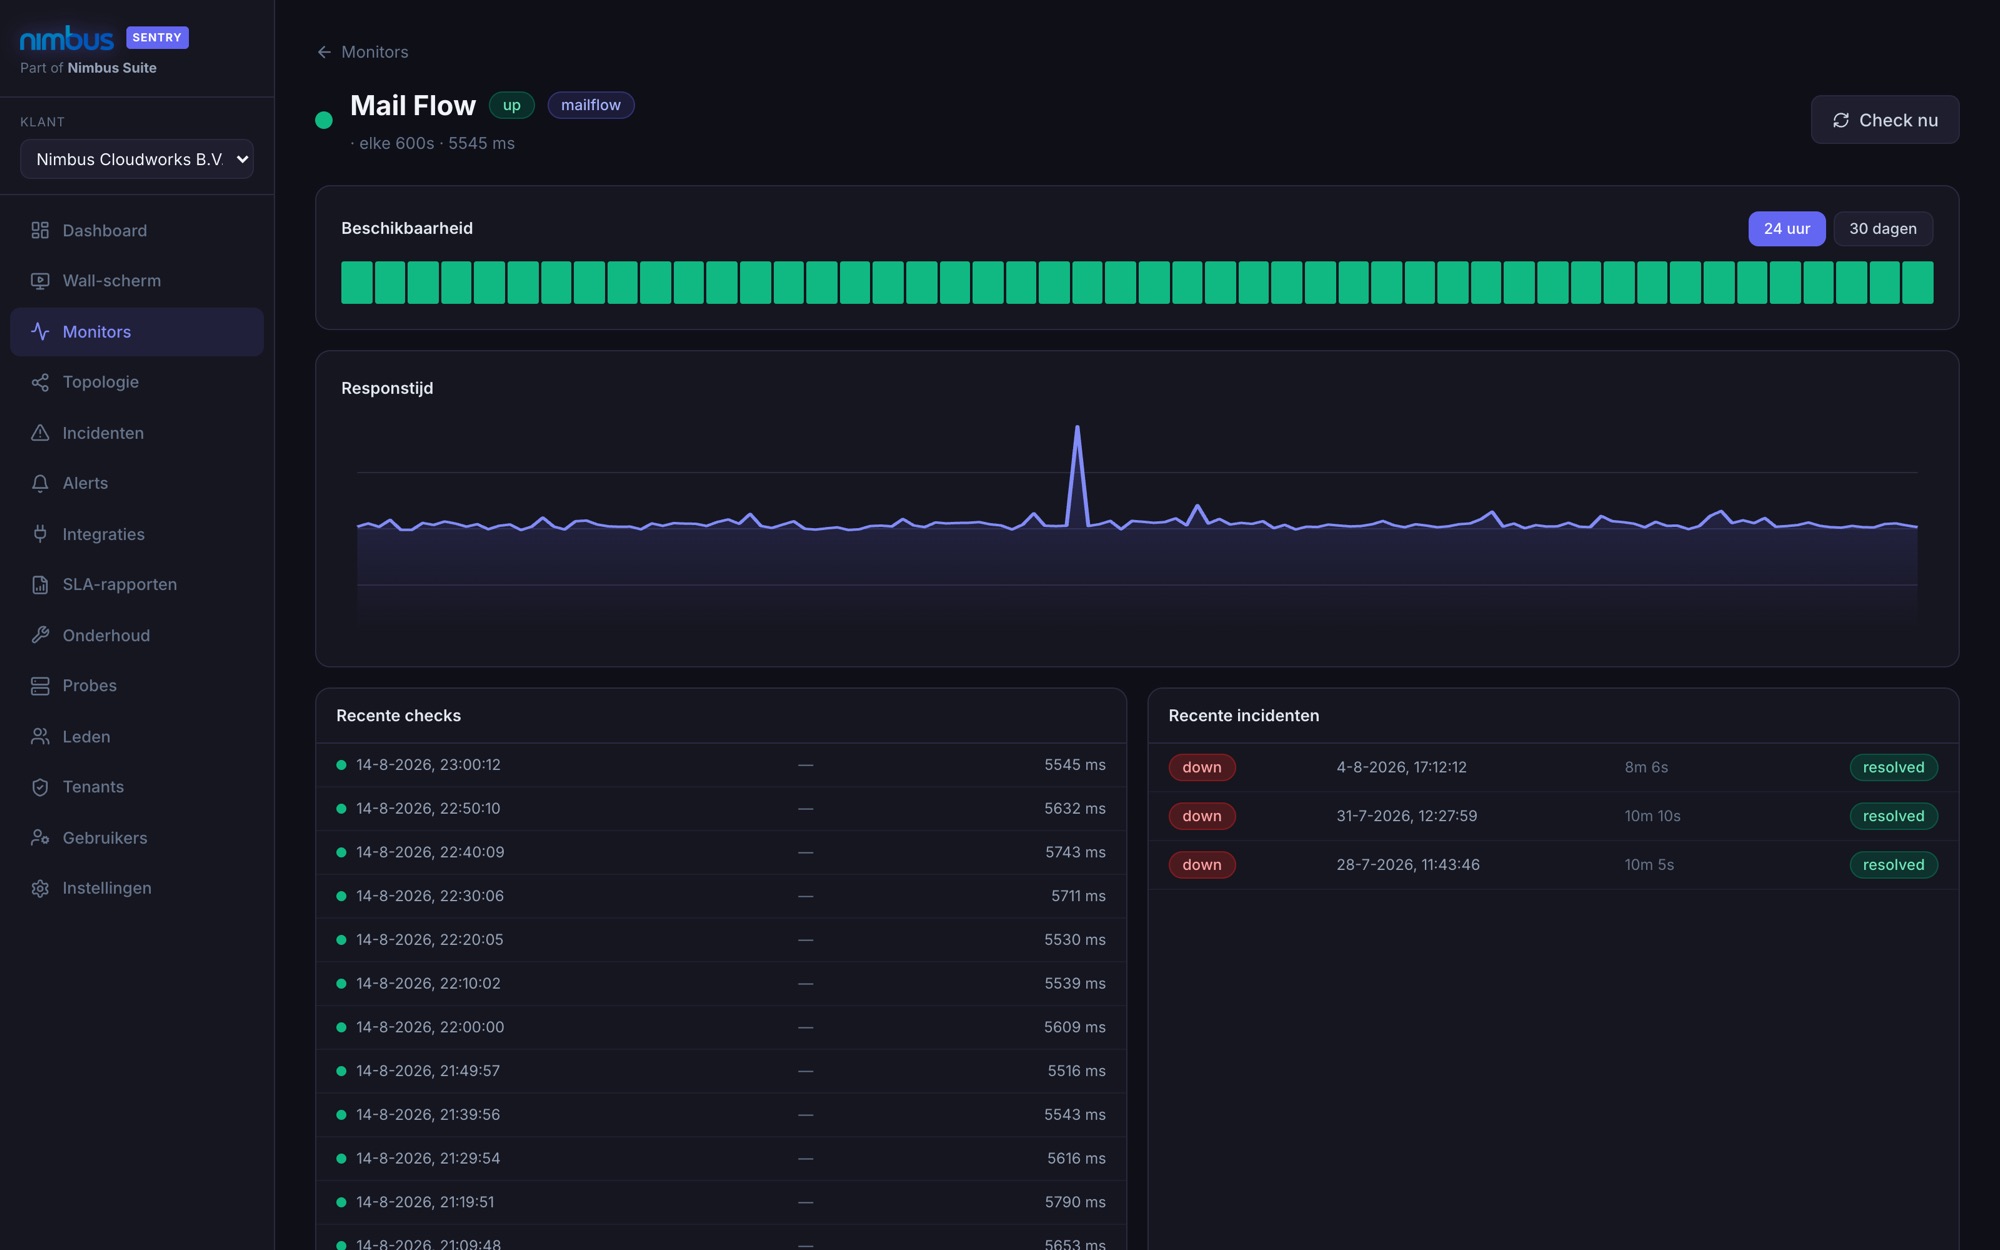
The history behind every outage
Click through on a monitor for the availability bar, the response time chart, every check that ran and the incidents that came out of it, with duration and cause. Handy for showing a supplier that the problem really was on their side.
- Response time over 24 hours or 30 days
- All checks with timestamp and result
- Incidents with duration and status
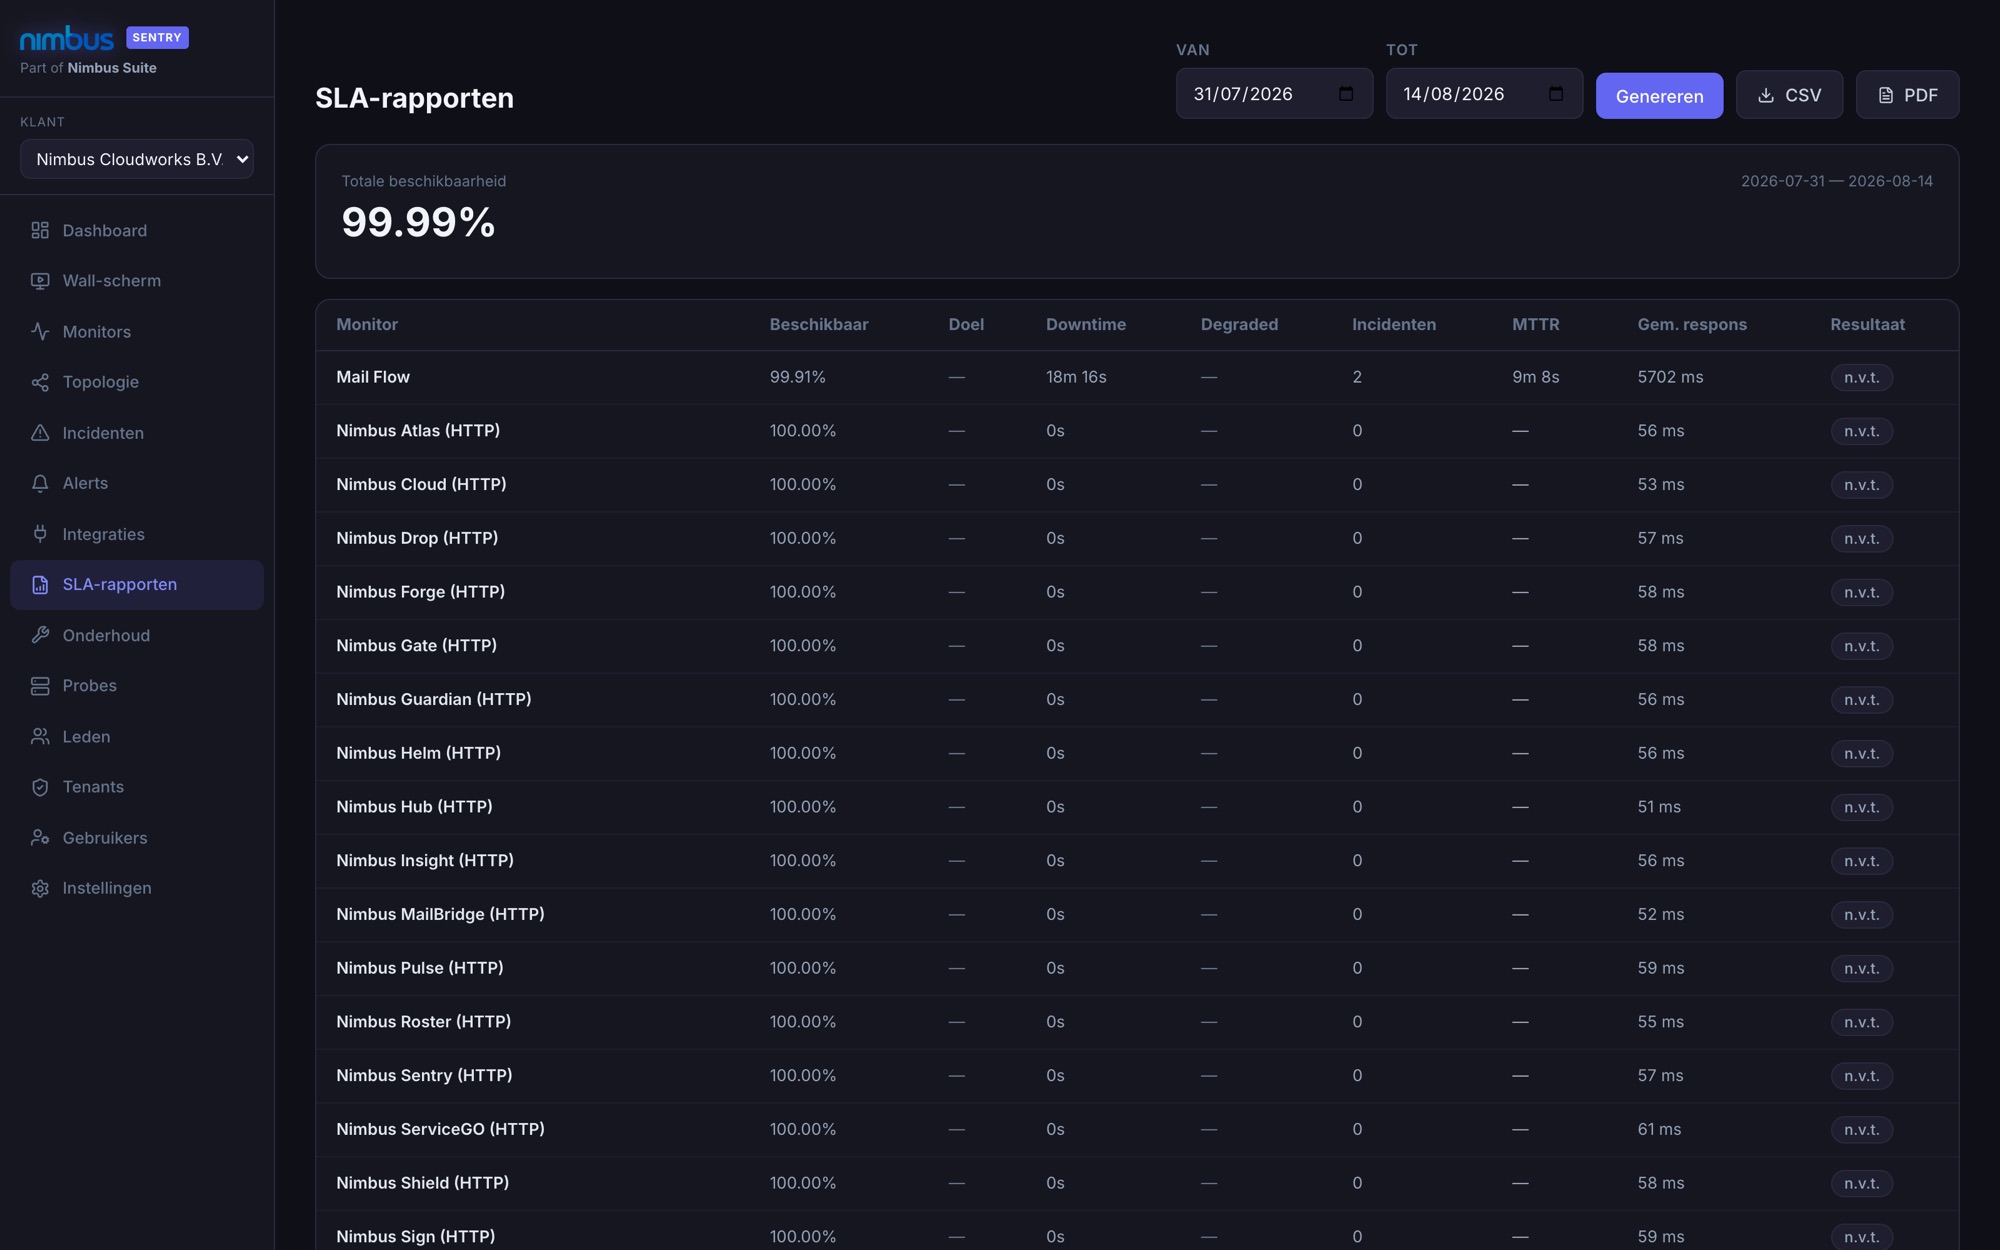
Availability you can simply send off
Pick a period and generate a report with availability per service, downtime, number of incidents, recovery time and average response time, set against the agreed target. Maintenance windows stay neatly out of scope.
- Total availability plus detail per service
- Export to CSV or a branded PDF report
- Automatically forwarded to Nimbus Insight
One cause, not twenty notifications
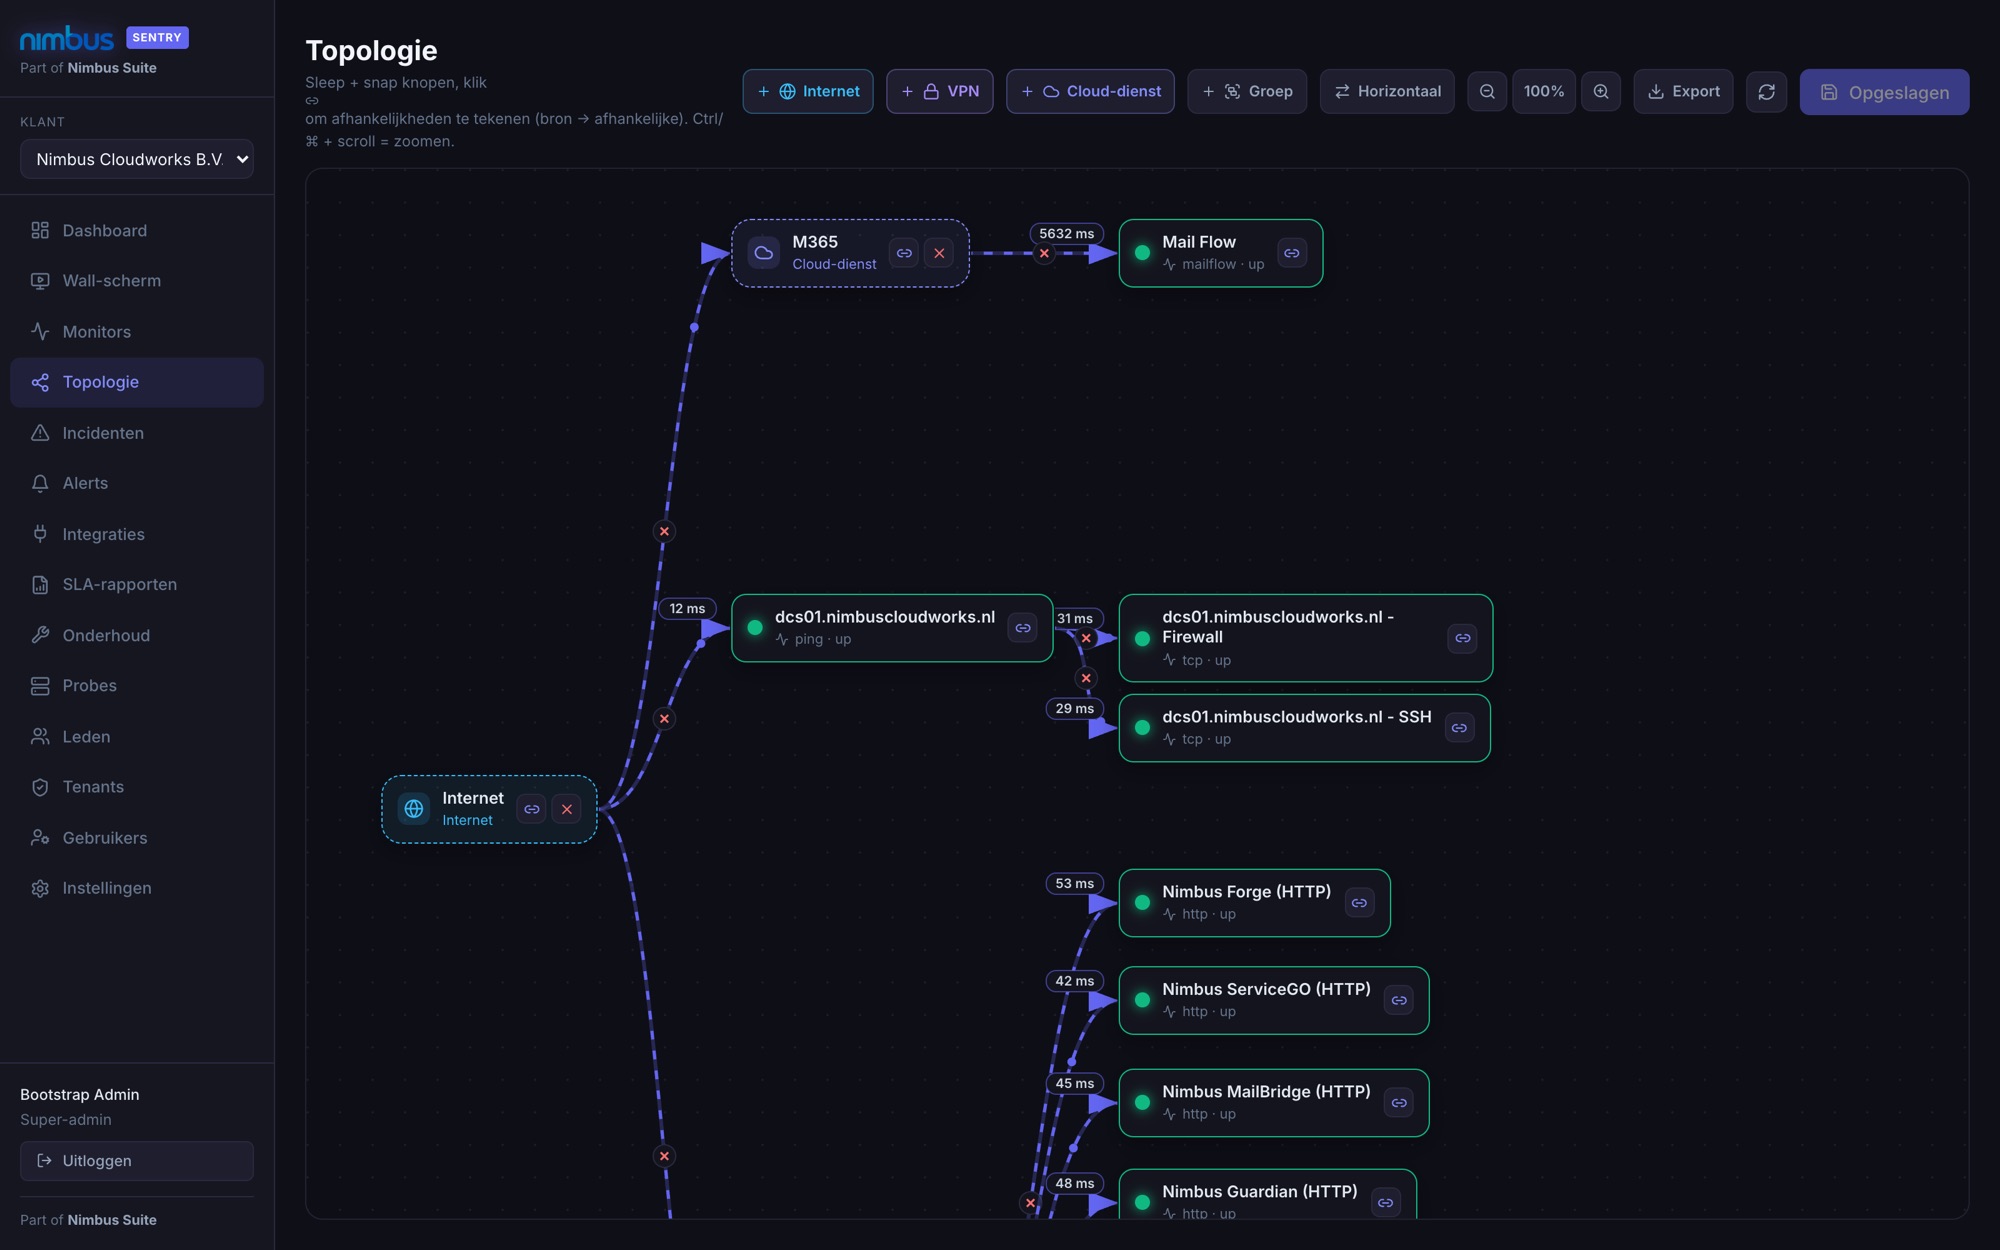
Draw the dependencies between internet, VPN, cloud services and your monitors. If the upstream connection drops, Sentry knows the rest hangs off it. That saves an avalanche of separate alerts and points straight to the real cause.
- Drag monitors and draw dependencies
- Latency per connection visible right away
- Follow-up alerts are suppressed
What Nimbus Sentry does
Monitor almost anything
HTTP and keyword, TCP, ping, DNS, SSL certificates, dead man's switch heartbeats, nameservers and Cloudflare. Websites, servers and network in one overview.
Instant alerts, also over WhatsApp
Notifications over WhatsApp, email, Slack, Teams, webhook or push to the mobile app. WhatsApp can even be free, without a Meta account.
SLA reporting
Availability, downtime and recovery time (MTTR) per customer, with maintenance windows neatly excluded. Export to CSV or a branded PDF report.
Public status page
A branded status page where customers see the current status and 90 days of history themselves. Fewer phone calls, more trust.
Measure from the customer site
Small on-site agents (Windows, Linux, macOS) watch internal systems from within the customer's network and send the results back securely.
Topology and root cause
Draw how systems depend on each other. If an upstream drops, Sentry suppresses the flood of follow-up alerts and points to the real cause.
NOC wall screen
A fullscreen dashboard for a large screen: KPIs, charts and a monitor wall where down flashes red, with sound on a new incident.
Mail flow and DNS health
Check whether email really arrives (M365, with delivery time) and whether MX, SPF, DMARC, DKIM and blocklists are in order. Plus certificate expiry on time.
Multi-tenant and secure
Strict separation per customer, roles and single sign-on via Nimbus Gate. Flap suppression prevents empty notifications on brief hiccups.
Why Sentry instead of separate tools
Standalone uptime services often only cover websites, only send email and leave internal systems out of sight. Sentry brings it all together, for multiple customers at once too.
| Feature | Standalone uptime service | Nimbus Sentry |
|---|---|---|
| Websites and servers | partly | ✓ |
| Internal systems via on-site agent | — | ✓ |
| WhatsApp alerts | rarely | ✓ |
| SLA report in PDF | limited | ✓ |
| Public status page | sometimes paid | ✓ |
| Root cause without alert storm | — | ✓ |
| Multiple customers separated | limited | ✓ |
Under the hood
- Monitor types http, tcp, ping, dns, ssl, heartbeat, ns, cloudflare, mailflow, mailrecords, hardware, vpn
- Alerts WhatsApp, email, Slack, Teams, webhook, mobile push
- Reporting availability, MTTR, degraded, maintenance windows, CSV and PDF
- Visibility status page, NOC wall screen, topology map, incidents
- Measurement points central and on-site agents (Windows, Linux, macOS)
- Management multi-tenant, roles, audit trail, Nimbus Gate SSO
Who it is for
SMBs and offices
Know straight away when the webshop, mail or internet connection falters, and fix it before customers notice.
MSPs and administrators
Watch all customers from one console, with on-site agents, separated reporting and a status page per customer.
Hosting and web agencies
Show provable uptime, catch certificate and DNS problems early and reduce the number of support calls with a public status page.
Put Nimbus Sentry to work for you
We set Sentry up for your environment or customers, including monitors, alerts, status page and reporting. Request a demo or let us take a look at your current monitoring.
Frequently asked questions
Can I really be alerted over WhatsApp for free?
Yes. Alongside email, Slack, Teams and push, Sentry can alert over WhatsApp without a paid Meta account, via our own integration. Preferably use a separate number for this.
Can Sentry also monitor internal systems?
Yes. Small on-site agents run within the customer's network and watch systems that are not reachable from outside, such as servers, hardware and internal services.
Will I get a storm of notifications when something big goes down?
No. With the topology map, Sentry knows which systems depend on each other. If an upstream drops, Sentry suppresses the follow-up alerts and reports the real cause.
Can I prove availability to customers?
Yes. Sentry creates SLA reports with availability, downtime and recovery time per customer, with maintenance windows excluded, as CSV or branded PDF.
Is there a public status page?
Yes, a branded status page with the current status and 90 days of history. Our own status page runs on it too.
Does it work for multiple customers?
Yes. Sentry is multi-tenant with strict separation, roles and single sign-on, made for MSPs and organizations with multiple environments.